1
2
3
4
5
6
7
8
9
10
11
import pandas as pdimport datetimeimport matplotlib.pylab as pltimport seaborn as snsfrom statsmodels.graphics.tsaplots import plot_acf, plot_pacffrom statsmodels.tsa.arima_model import ARIMAplt.style.use('ggplot' ) plt.rcParams['font.sans-serif' ] = ['SimHei' ] plt.rcParams['axes.unicode_minus' ] = False
1
2
3
4
5
stockFile = './data/T10yr.csv' stock = pd.read_csv(stockFile, index_col=0 , parse_dates=[0 ]) print (stock.tail(10 ))
             Open   High    Low  Close  Volume  Adj Close
Date
2016-07-18  1.577  1.604  1.556  1.587       0      1.587
2016-07-19  1.553  1.575  1.546  1.558       0      1.558
2016-07-20  1.568  1.596  1.566  1.580       0      1.580
2016-07-21  1.601  1.628  1.563  1.565       0      1.565
2016-07-22  1.585  1.599  1.544  1.570       0      1.570
2016-07-25  1.584  1.584  1.554  1.571       0      1.571
2016-07-26  1.559  1.587  1.549  1.563       0      1.563
2016-07-27  1.570  1.570  1.511  1.515       0      1.515
2016-07-28  1.525  1.535  1.493  1.511       0      1.511
2016-07-29  1.525  1.530  1.458  1.458       0      1.458
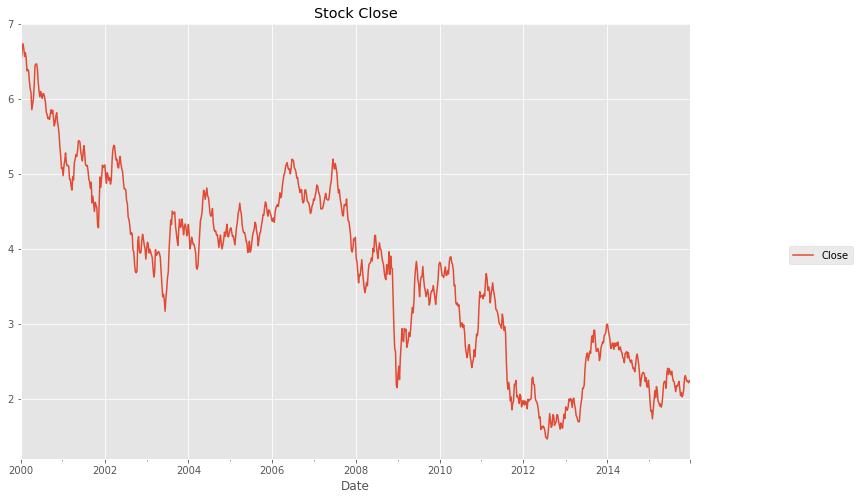
1 2 3 4 5 6 7 8 9 stock_week = stock['Close' ].resample('W-MON' ).mean() stock_train = stock_week['2000' :'2015' ] stock_train.plot(figsize=(12 , 8 )) plt.legend(bbox_to_anchor=(1.25 , 0.5 )) plt.title("Stock Close" ) sns.despine() plt.show()
//anaconda3/lib/python3.7/site-packages/matplotlib/font_manager.py:1328: UserWarning: findfont: Font family ['sans-serif'] not found. Falling back to DejaVu Sans
  (prop.get_family(), self.defaultFamily[fontext]))
1 2 3 4 5 6 7 stock_diff = stock_train.diff() stock_diff = stock_diff.dropna() plt.figure() plt.plot(stock_diff) plt.title('一阶差分' ) plt.show()
1 2 3 4 acf = plot_acf(stock_diff, lags=20 ) plt.title("ACF" ) acf.show()
//anaconda3/lib/python3.7/site-packages/matplotlib/figure.py:459: UserWarning: matplotlib is currently using a non-GUI backend, so cannot show the figure
  "matplotlib is currently using a non-GUI backend, "
1 2 3 4 pacf = plot_pacf(stock_diff, lags=20 ) plt.title("PACF" ) pacf.show()
1
2
3
model = ARIMA(stock_train, order=(1 , 1 , 1 ), freq="W-MON" ) result = model.fit() print (result.summary())
                             ARIMA Model Results
==============================================================================
Dep. Variable:                D.Close   No. Observations:                  834
Model:                 ARIMA(1, 1, 1)   Log Likelihood                 720.846
Method:                       css-mle   S.D. of innovations              0.102
Date:                Wed, 19 Aug 2020   AIC                          -1433.692
Time:                        17:26:05   BIC                          -1414.787
Sample:                    01-10-2000   HQIC                         -1426.444
                         - 12-28-2015
=================================================================================
                    coef    std err          z      P>|z|      [0.025      0.975]
---------------------------------------------------------------------------------
const            -0.0052      0.005     -1.145      0.252      -0.014       0.004
ar.L1.D.Close     0.2841      0.203      1.397      0.163      -0.115       0.683
ma.L1.D.Close    -0.0869      0.213     -0.408      0.683      -0.504       0.330
                                    Roots
=============================================================================
                  Real          Imaginary           Modulus         Frequency
-----------------------------------------------------------------------------
AR.1            3.5199           +0.0000j            3.5199            0.0000
MA.1           11.5087           +0.0000j           11.5087            0.0000
-----------------------------------------------------------------------------
1 2 3 4 pred = result.predict('20140609' , '20160704' , dynamic=True , typ='levels' ) print (pred)
2014-06-09    2.463559
2014-06-16    2.455539
2014-06-23    2.449569
2014-06-30    2.444183
2014-07-07    2.438962
2014-07-14    2.433788
2014-07-21    2.428627
2014-07-28    2.423470
2014-08-04    2.418315
2014-08-11    2.413159
2014-08-18    2.408004
2014-08-25    2.402849
2014-09-01    2.397693
2014-09-08    2.392538
2014-09-15    2.387383
2014-09-22    2.382227
2014-09-29    2.377072
2014-10-06    2.371917
2014-10-13    2.366761
2014-10-20    2.361606
2014-10-27    2.356451
2014-11-03    2.351296
2014-11-10    2.346140
2014-11-17    2.340985
2014-11-24    2.335830
2014-12-01    2.330674
2014-12-08    2.325519
2014-12-15    2.320364
2014-12-22    2.315208
2014-12-29    2.310053
                ...
2015-12-14    2.052288
2015-12-21    2.047132
2015-12-28    2.041977
2016-01-04    2.036822
2016-01-11    2.031666
2016-01-18    2.026511
2016-01-25    2.021356
2016-02-01    2.016200
2016-02-08    2.011045
2016-02-15    2.005890
2016-02-22    2.000734
2016-02-29    1.995579
2016-03-07    1.990424
2016-03-14    1.985269
2016-03-21    1.980113
2016-03-28    1.974958
2016-04-04    1.969803
2016-04-11    1.964647
2016-04-18    1.959492
2016-04-25    1.954337
2016-05-02    1.949181
2016-05-09    1.944026
2016-05-16    1.938871
2016-05-23    1.933715
2016-05-30    1.928560
2016-06-06    1.923405
2016-06-13    1.918249
2016-06-20    1.913094
2016-06-27    1.907939
2016-07-04    1.902784
Freq: W-MON, Length: 109, dtype: float64
1 2 3 4 5 plt.figure(figsize=(6 ,6 )) plt.xticks(rotation=45 ) plt.plot(pred) plt.plot(stock_train) plt.show()


